.png?height=120&name=FinPro%20logo%20full%20color%20(1).png)
Assess your bank's loan portfolios
1. Generate Model
Let's use Sample Bank as an example to run the Portfolio Analytics Model in the Dashboard

Once you click on "Generate Dashboards," an Authoring message will pop-up. This message shares our most recent troubleshooting tips. Once you have read through the message, click "Yes."

After you click "Yes," the below message will pop-up. This message lets you know that if another user requests the same Model, they would be joining as an active user in the Model. Click on "OK" to continue.

2. Tab Generation
The Portfolio Analytics Model will appear on your browser, and you will be taken directly into the Model.

3. Landing Page
This tab shows the name of the Model and has a forward icon to move to the next tab.

4. Navigation Pane
This tab shows you the list of navigation icons in the Dashboard and where they will take you.

5. Home Tab
This tab shows you the list of sections in the Dashboard and their summary description. You will be able to move through the contents of the Model by clicking on the forward arrows next to each Linked Guide.

6. Key Ratios
This tab shows the chosen bank and selected comparable groups key asset quality ratios compared to FinPro Industry Thresholds. High risks are highlighted red, moderate risks are highlighted yellow, and low risks are highlighted green.

7. Portfolio Comparison
This tab shows the chosen bank and selected comparable groups in the current quarter for loan concentration, nonaccrual composition, charge-off composition, recovery composition, and past due compositions - allowing the user to quickly determine variances for each of the comparable groups.

8. Historical Trend
This tab provides the 8-quarter trend for the bank's: loan concentration, nonaccrual composition, charge off composition, recovery composition, and past due compositions. Quarterly and annual variances are also provided to help the user with overall portfolio trends.

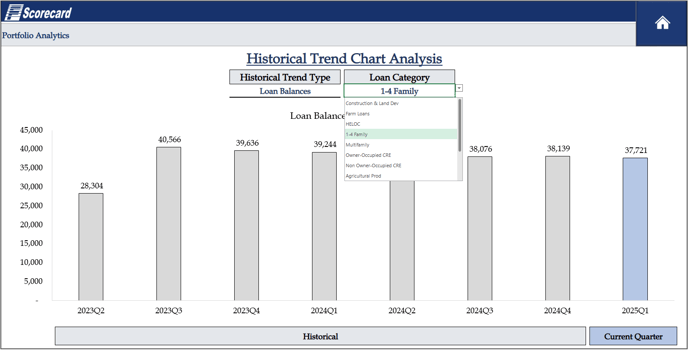
9. Historical Trend Chart
This tab provides a detailed trailing eight quarter chart of each component for each portfolio comparison and allows the user to focus on one key component at a time. A drop-down box to change the portfolio comparison and a dropdown box of each loan type are located above of the chart.

See where the drop-downs are located, below:

10. Charge Offs
This tab allows the user to input charge off levels by loan category to determine the overall impact of an asset quality stress on earnings and capital.

11. Nonaccrual
This tab allows the user to change the level on nonaccrual loans and the charge off level for each of these nonaccrual loans to determine the overall impact of an asset quality stress on ACL, asset quality, earnings, capital and other key ratios.

12. Projected Charge Offs
This analysis allows the user to compare the level of change offs used in the first single variable stress test to actual performance, calculating the multiple of actual charge offs.
