.png?height=120&name=FinPro%20logo%20full%20color%20(1).png)
Compare your institution with other institutions
1. Generate ModelLet’s use Sample Bank as an example to run the Peer Model in the Dashboard.

2. Peer Groups
Clicking “Edit Peer Groups” will bring you to the list of saved Peer Groups. You can then click “Create Group” to create a new Peer Group.

Clicking “Create Group” will take you to the Select Companies page where you can determine the number of banks that match your selected custom criteria.
-
- To create a Peer Group, make sure the number of matched banks is between 5 to 20
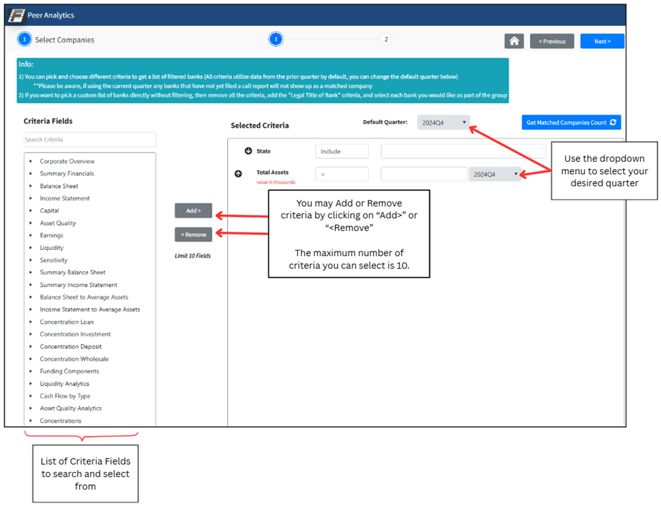
For our Sample Bank example, we want to find banks in neighboring states. Type in the states in the field shown below, and they will populate in the dropdown menu for you to select. In our case, we’re typing in and selecting Wisconsin.

We also want to find banks in these states that have total assets between $500 million and $800 million. To do this, go to the Total Assets criteria and select "Between" from the drop-down menu. Then type 500,000 and 800,000 into the value field as the value is in thousands.

Lastly in our example, we want to find banks in the selected state with the asset size selected, that also have return on average assets (ROAA) greater than 1%. To do this, type in ROAA in the search bar under the Criteria Fields section on the left-hand side. Add the criteria to the Selected Criteria list by clicking on ROAA (listed under Summary Financials) and then clicking "Add>"

Select the greater than symbol “>” in the dropdown menu and type 1 in the value field since the value is calculated in percentages. The ROAA is selected based on FinPro's Thresholds.

Click the Get Matched Companies Count button to see how many banks match your criteria. For our example, there are 11 banks match our criteria. Since our match is between 5 and 20 banks, we can create a Peer Group. Click the Next button on the top right-hand corner to continue. 
4. View Companies
This page shows you the list of companies that match your custom criteria. Make sure to check that your own bank is not included on this list 
If you want to remove a company from the list, uncheck the box next to the company that you want removed. A pop-up will appear asking you to document the reason. Type in the reason & click save.


The company you removed will have a red triangle symbol next to it. This indicates the company has been removed. Clicking the red triangle will bring the pop-up message with your entered reason, back to your screen. For our Sample Bank example, we’ll keep all of the banks on the list. Click “Save Group Profile” to save your Peer Group.

5. Save Peer Group
A pop-up will appear asking you to type in the name and description of the Peer Group. Type in what you would like to name the group along with a description of the Peer Group, then click Save.

6. Refresh
Once you save your Peer Group, you will be taken back to the Generate Model page. Click the Refresh Button next to Primary Peer.

When the Authoring pop-up appears, click Yes to continue

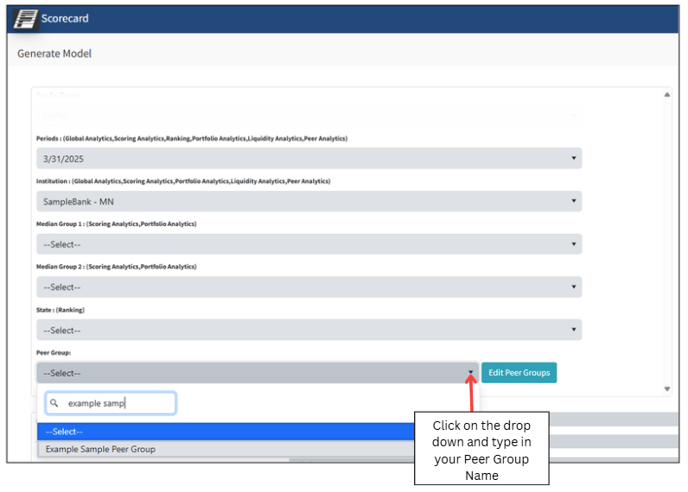
7. Select Peer Group
After you hit Refresh, the newly created Peer Group shows up in your filter dropdown. To search for and select your newly added Peer Group, click on the down arrow and type in the name of your Peer Group. In our example, we selected Example Sample Peer Group
8. Generate Dashboard
Once you’ve selected your Peer Group, Generate the Dashboard by marking off “Peer Analytics” under the Dashboard column on the right-hand side and clicking “Generate Dashboards”

Pop-Up Message
Once you click on Generate Dashboards, an Authoring message will pop-up. This message shares our most recent trouble shooting tips. Once you have read through the message, click “Yes”

After you hit Yes, the below message will pop-up. This lets you know that if another use requests the same Model, they would be joining as an active user in the Model. Click on OK to continue.

9. Tab Generation
The Peer Model will appear on your browser, and you will be taken directly into the Peer Analytics Model.

10. Landing Page
This tab shows the name of the Model, and has a forward icon to move to the next tab. You can also move through the tabs using the tabs at the bottom of the Dashboard.

11. Navigation Pane
This tab shows you the list of navigation icons in the Dashboard and where they will take you.
12. Home
This tab shows you the list of sections in the Dashboard and their summary description. You will be able to move through the contents of the Model by clicking on the forward arrows next to each Linked Guide.

13. Corporate Overview
This tab provides a Corporate Overview of each of the selected peer banks compared to the chosen bank.
14. Executive Summary
This tab provides an Executive Summary of each of the selected peer banks compared to the chosen bank - including minimum, maximum, average, and median.
15. Balance Sheet
This tab provides a Balance Sheet summary of each of the selected peer banks compared to the chosen bank - including minimum, maximum, average, and median.

16. Income Statement
This tab provides an Income Statement summary of each of the selected peer banks compared to the chosen bank - including minimum, maximum, average, and median.
17. Capital
This tab provides Capital ratios of each of the selected peer banks compared to the chosen bank - including min, max, average, and median.
18. Asset Quality
This tab provides Asset Quality ratios of each of the selected peer banks compared to the chosen bank - including minimum, maximum, average, and median.
19. Earnings
This tab provides Earnings ratios of each of the selected peer banks compared to the chosen bank - including minimum, maximum, average, and median.
20. Liquidity
This tab provides Liquidity ratios of each of the selected peer banks compared to the chosen bank - including minimum, maximum, average, and median.
21. Sensitivity
This tab provides Sensitivity ratios for each of the selected peer banks compared to the chosen bank - including minimum, maximum, average, and median.