Global
The Global Dashboard provides balance sheet, income statement, and concentration analytics - displaying level and trend across each line item.
The Global Overview page will default to Step 1 of Section 1: Financials. Clicking "Launch Page" will take you to the Balance Sheet Trend & Performance:

This step gives you a clear look at the institution's financial health over the current & past four quarters. It breaks down assets, liabilities, and equity, showing how each has changed quarter-to-quarter and year-over-year. You’ll also see how each item compares to total assets, so you can easily spot what’s driving the numbers.

Click "Home" to maneuver through the sections of the Global Model. Step 2 will bring you to the Income Sheet Trend & Performance:

This step gives you a clear snapshot of how the institution is doing financially. It covers the current quarter as well as the last four and breaks down revenue and expenses, showing how things have changed quarter-to-quarter and year-over-year.
You’ll also see annualized numbers for each item, plus how they stack up as a percentage of average assets to help put everything in context.

Step 3 will bring you to the Institution's Financial Summary Overview:

This step looks at the big categories from the balance sheet and income statement, showing how they’ve changed from last quarter and last year. You’ll also see where things stand right now, so it’s easy to spot trends and shifts over time.
Use the drop down to switch between composition types:

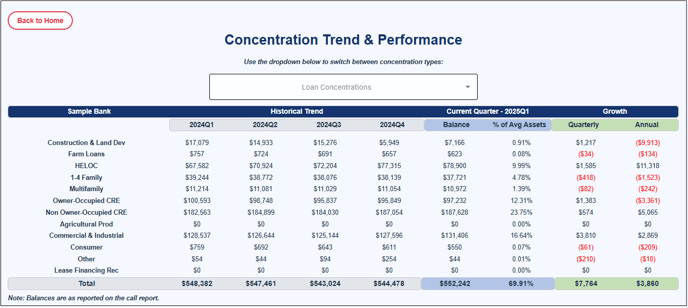
Step 1 of Section 2 will bring you to Concentration Analysis details:

Use the drop down to switch between the provided concentration types:
