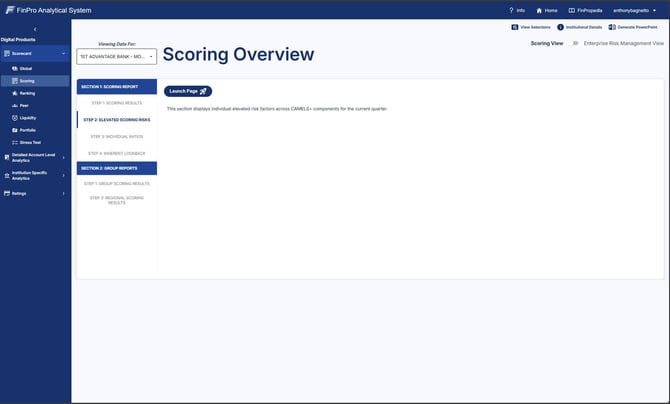
Scoring Overview
- The Scoring Overview Page houses Scoring Results, Elevated Scoring Risks, Individual Ratios, Group Scoring Results, and Regional Scoring Results.
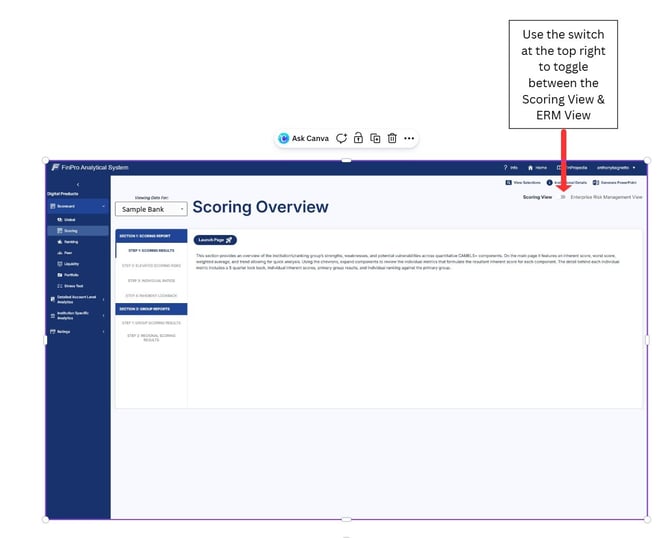
- On this page, you will have the option to view the Dashboard in Scoring View or ERM View:
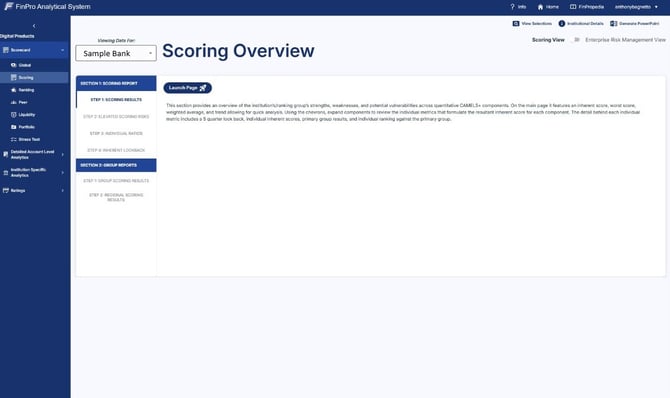
The Scoring Overview page will default to Step 1 of Section 1. Clicking "Launch Page" brings us to Scoring Results:
This step displays the CAMELS+ components along with the current quarter’s inherent and worst score, as well as the previous 4 quarters' weighted average and the year over year quarterly trend.
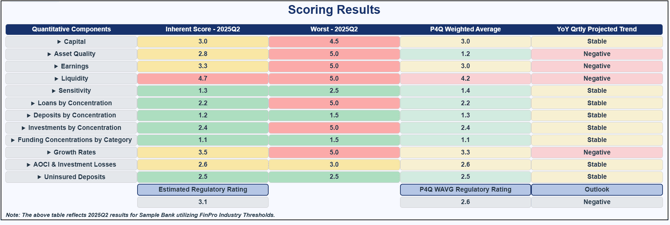
Click the arrow next to each CAMELS+ component to expand it and view the detailed metrics for that specific component.
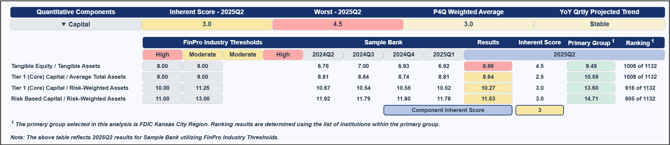
Be sure to check the note at the bottom of the page advising the table reflects your selections.

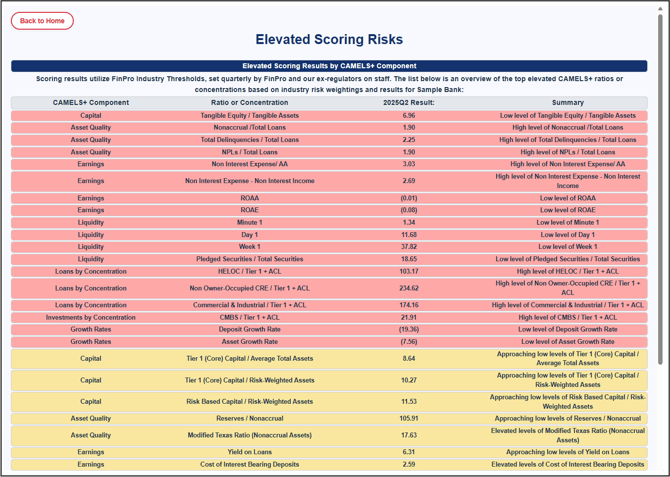
Step 2 brings us to Elevated Scoring Risks :
This step highlights the individual metrics that are considered high or moderate risk based on either FinPro Industry Thresholds or Institution Provided Thresholds. Metrics are grouped by risk level, followed by CAMELS+ factor.
In addition to the resultant value for each metric, this section also gives a brief description of why each metric is considered high or moderate risk.
Step 3 brings us to Individual Ratios:
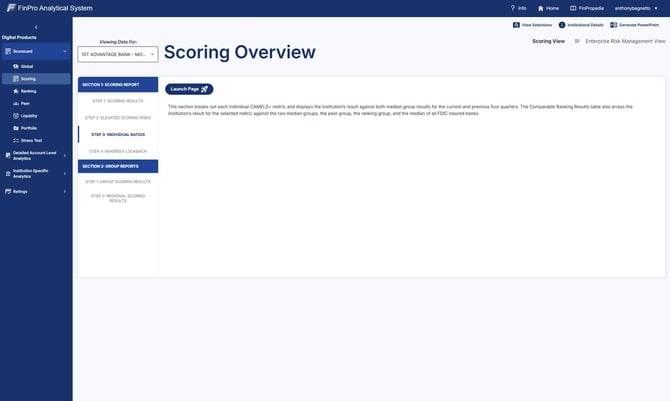
This step breaks out each individual CAMELS+ metric and displays the institution’s result against both median group results for the current and previous four quarters.
The table on the left will give you a historical view for the chosen ratio or concentration.
The table on the right then gives you the ranking and comparability for the institution across the selected median groups, peer group, ranking group & the median of all FDIC insured banks.
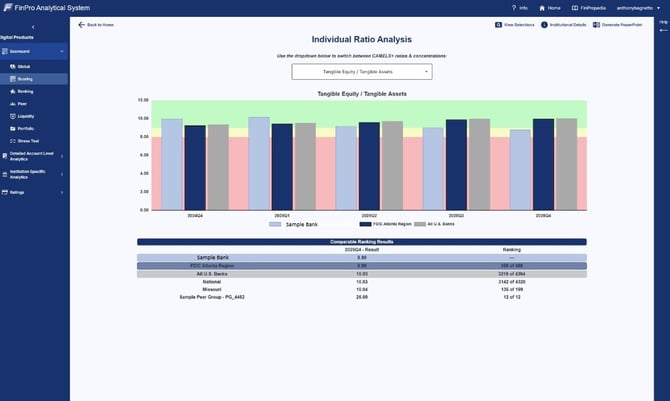
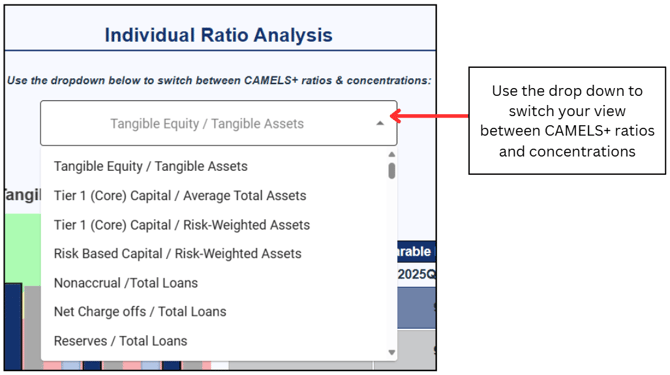
Use the dropdown to switch between CAMELS+ ratios & concentrations.
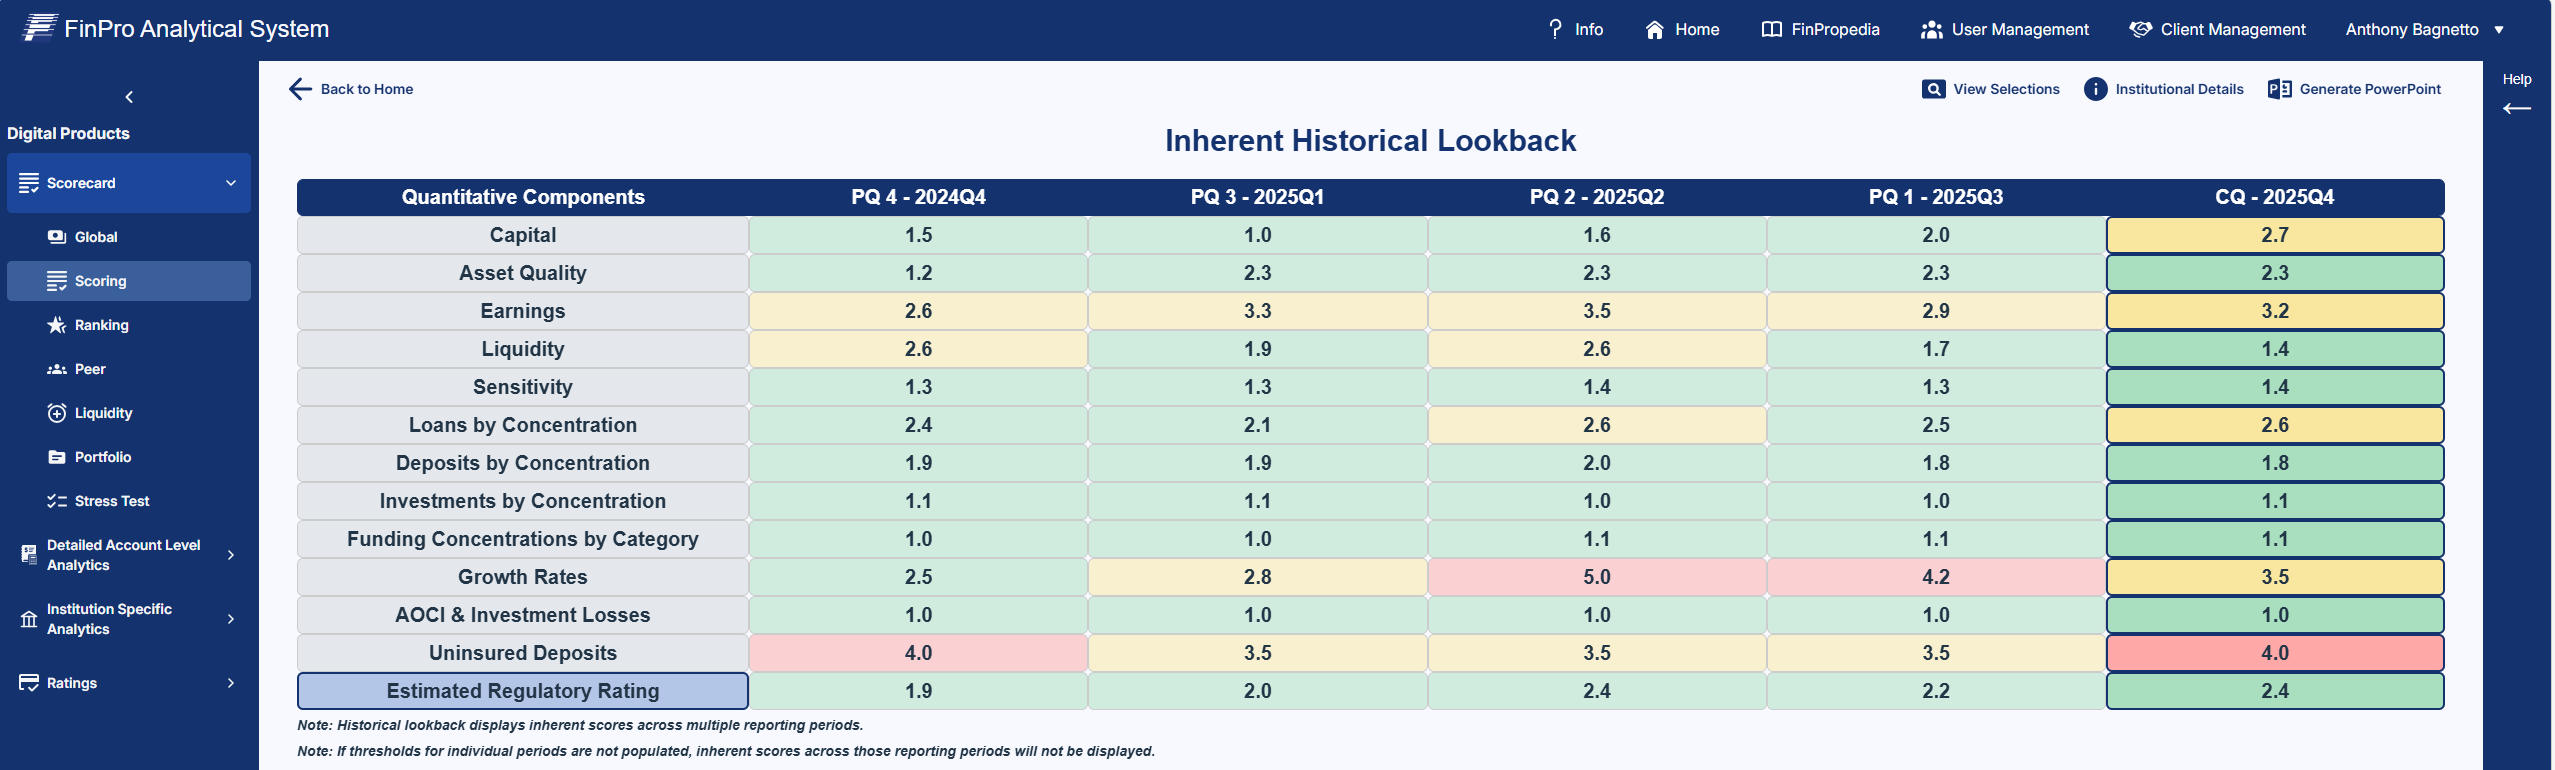
Step 4 brings us to the Inherent Historical Lookback.
This section allows you to review an institutions historical inherent score by CAMELS+ component. You can see current and previous 4 quarters results for each Inherent Component Score.
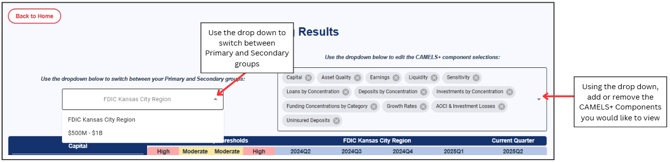
Step 1 of Section 2 brings us to the Group Scoring Results:
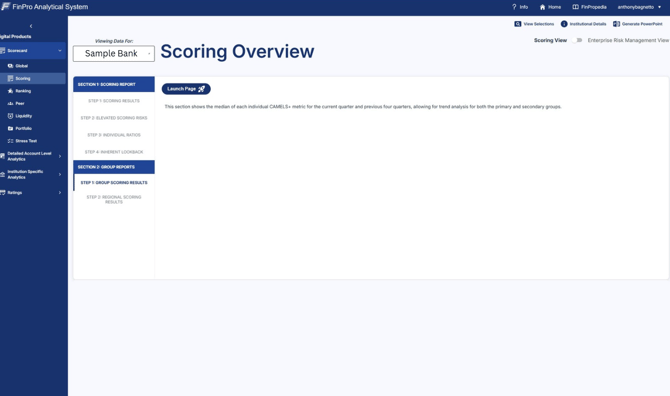
This step shows the median of each individual CAMELS+ metric for the current and previous four quarters, allowing for trend analysis for both the primary and secondary groups.
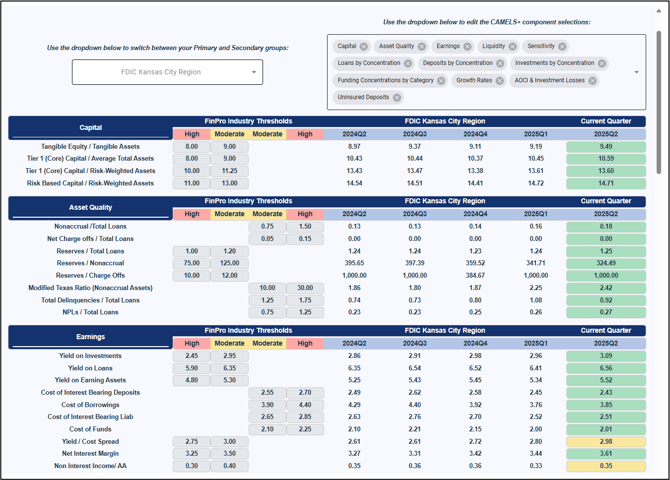
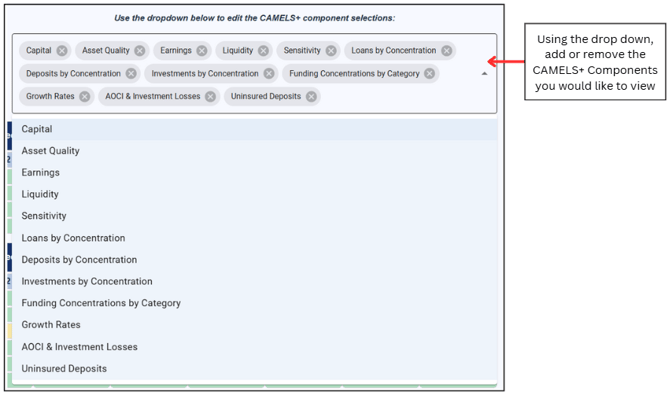
Use the drop downs to switch between Primary and Secondary groups as well as adding or removing the CAMELS+ Components you would like to view. Use the drop down on the right to add or remove the camels+ components. You may also simply x out of the components you would like to remove from the screen.
Step 2 brings us to the Regional Scoring Results:

This step is institution agnostic and displays the median individual CAMELS+ metrics for all FDIC insured banks, as well as the medians for each FDIC supervisory region.
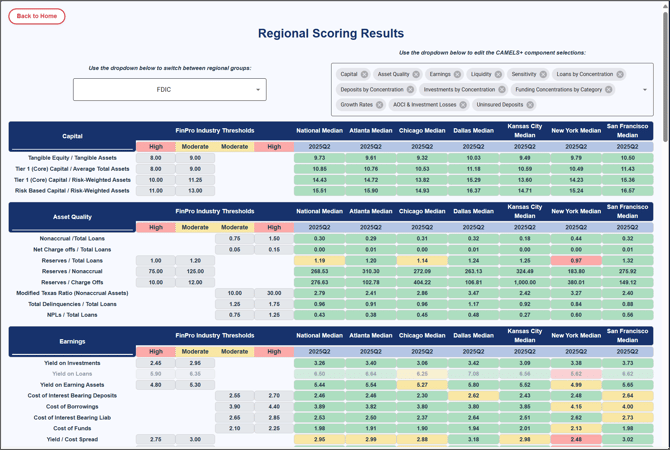
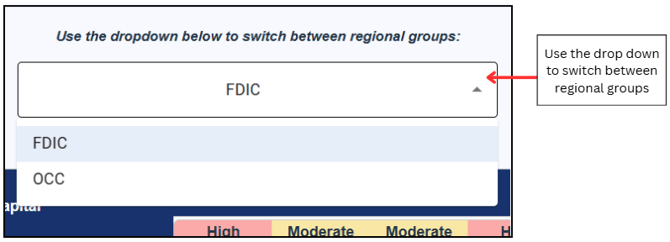
Use the drop down on the left to switch between regional groups:
Use the drop down on the right to add or remove the CAMELS+ components you would like to view.